

Ask a director their occupancy and you'll get a number to the decimal. Ask how many enquiries last month became tours and the room goes vague. That's not a criticism, it's an artefact of tooling: occupancy lives in the management platform where it's counted automatically, while the pre-enrolment stretch lives in inboxes and memory, where nothing counts anything.
Yet the pre-enrolment numbers are the ones that predict occupancy's future. Five of them are enough.
1. Enquiries per month
The raw intake, counted across every channel: forms, calls, messages, walk-ins. It's the number that tells you whether you have a visibility problem or a conversion problem, which is the first fork in every enrolment diagnosis. A centre with plentiful enquiries and empty rooms leaks; a centre with few enquiries starves, and the fixes are entirely different. Counting it at all requires the one discipline most centres skip: every channel landing in one list.
2. Time to first response
The clock from enquiry to first substantive reply, the hour that frames everything after it. Measured honestly, across all channels, including the Saturday voicemail. This is the number most improved by automation and the one where centres discover the gap between belief ("we're pretty quick") and log ("nineteen business hours, median").
3. Enquiry-to-tour rate
Of the families who raised a hand, how many stood in your foyer? This is the systems number: it bundles your response speed, your follow-up persistence and your booking friction into one honest percentage. It's also the number that moves fastest when you fix those three, which makes it the most motivating thing a centre can start tracking.
4. Tour-to-enrolment rate
The human number. Families who tour have cleared every digital hurdle; what converts them now is the visit, the follow-through afterwards, and the fit. If this number sags while tours are plentiful, the investigation is warm and specific: what happens on the tour, what happens in the deliberation fortnight after it, and whether anyone sends the follow-ups that keep you present while the family decides.
5. Pipeline age
The quiet fifth: how long open enquiries have been open, and how many have had no touch in the last month. It's the number that exposes the drift a busy centre can't feel, the families who neither enrolled nor left, just faded, and it's the reason a pipeline beats a waitlist. A healthy pipeline is warm all the way through; an ageing one is a list rotting in place.
What the five buy you
Together they turn the monthly conversation from mood into mechanism. "Enrolments feel slow" becomes "enquiries held, but enquiry-to-tour halved since March, and response time doubled when Renae went on leave", a sentence that contains its own fix. They also arm the spending decisions: marketing budget flows sensibly only once you know whether the funnel needs more water or fewer holes.
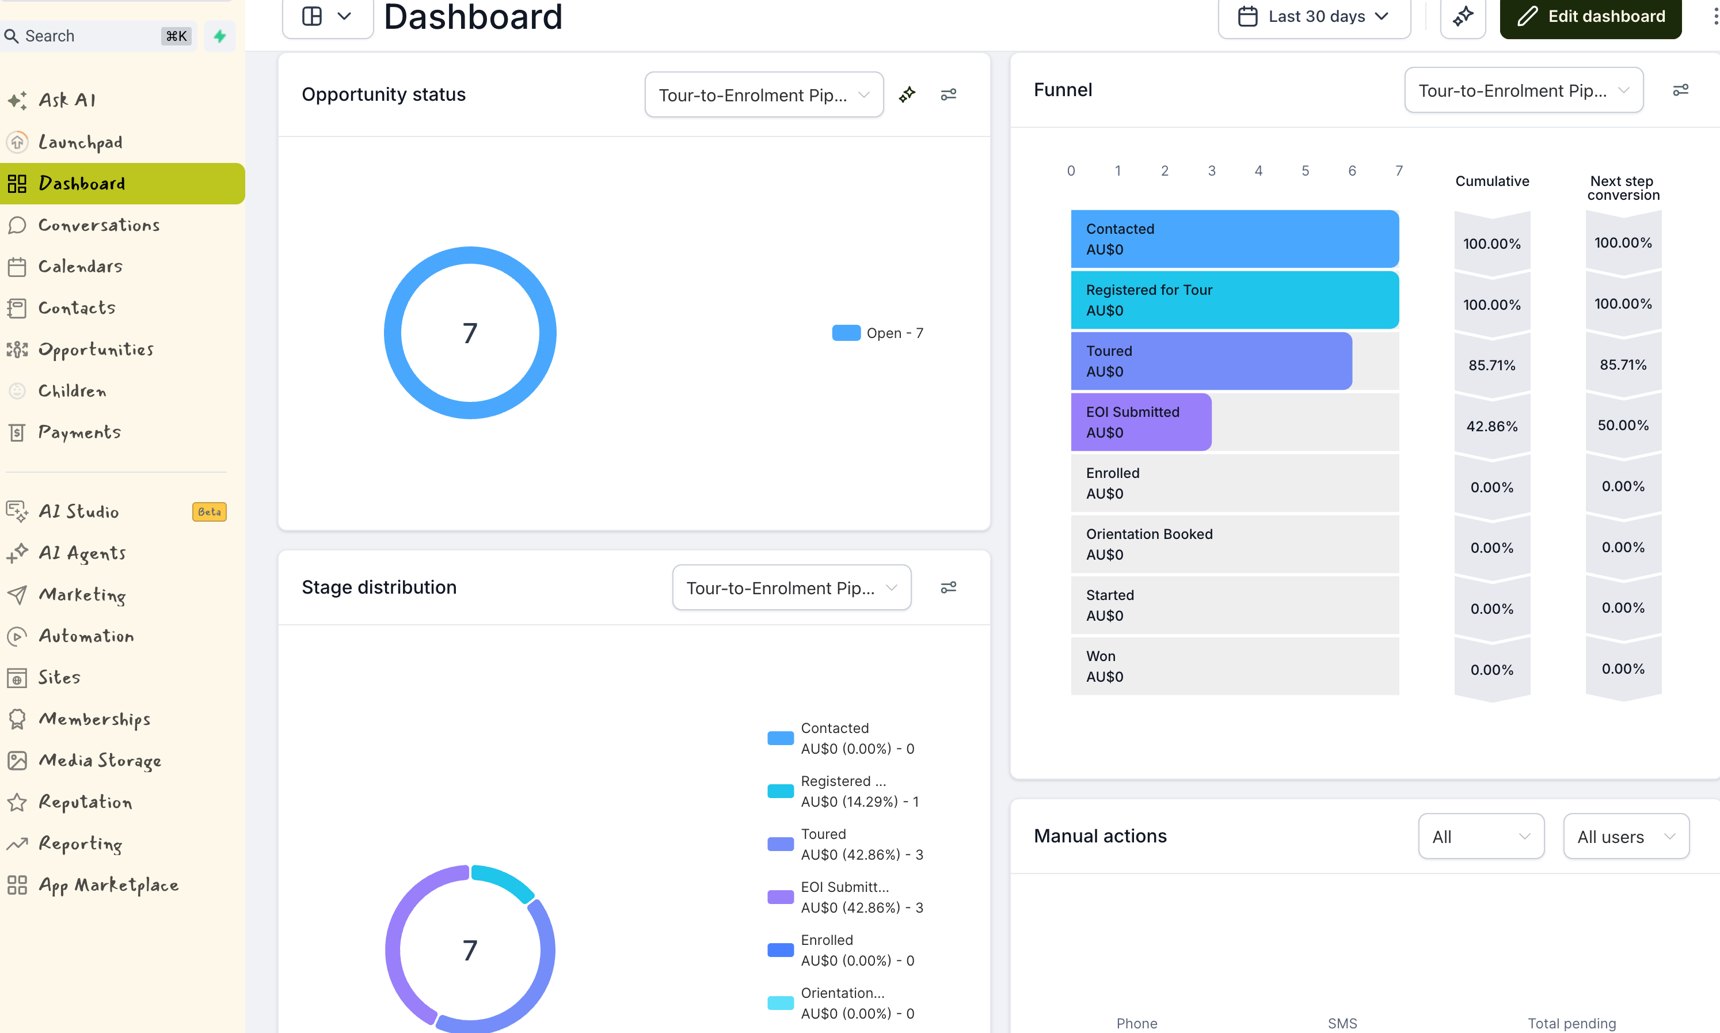
The catch, and it's the same catch as every guide in this cluster: these numbers can't be assembled by hand without someone burning hours in spreadsheets, so in practice they exist only where the system produces them as a by-product of doing the work. Our Enrolment Content Engine reports all five on one screen because the enquiries, bookings and follow-ups already flow through it; the counting is free.
If you want your baseline without building anything first, the free Enrolment Story Audit estimates the shape of your funnel from the outside, where families come from, where they're likely stalling, and hands you the starting map within 48 hours.